Tracking a TID

TID = Travelling Ionospheric Disturbance

Using Tomographic Reconstruction of GPS data


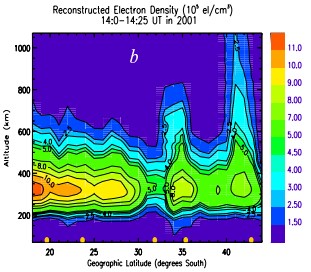
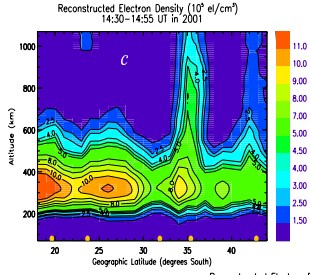
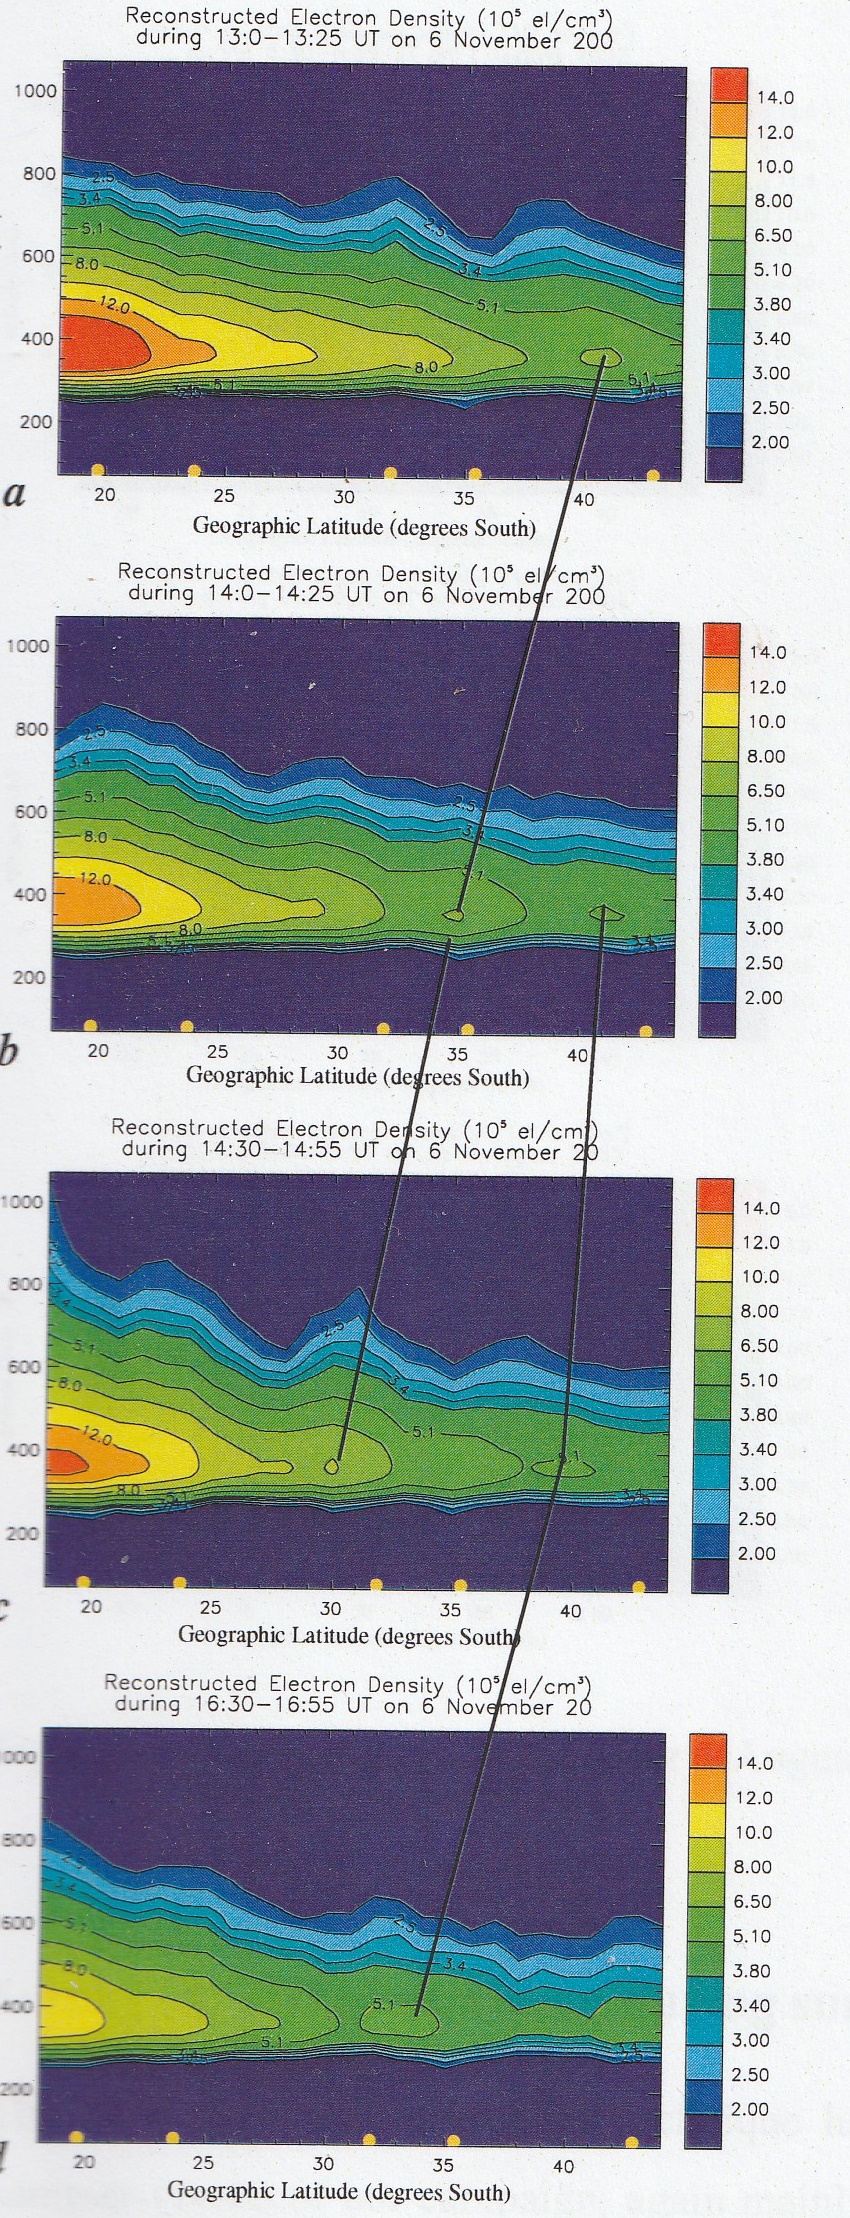
To the left are ionspheric electron density obtained by reconstruction of GPS data recorded during successive time periods on November 6, 2000. What is plotted is the computed electron density colour coded using the scheme to the right at each panel at height up to 1000km against the geographic latitude (south). Because of data gathering issues data for each ionospheric reconstuction is gathered over a 25 minute Universal Time (UT) range as follows:
  • a UT 1300-1325
  • b UT 1400-1425
  • c UT 1430-1455
  • d UT 1630-1655
Lines are drawn over the panel to show the TID (travelling ionospheric disturbance) passing through the mid-latitude region in the southern hemisphere. Note that the TID motion is northward (towards the equator).

From page 162 of Endawoke Yizengaw's PhD thesis, Imaging the Ionosphere submitted 29/10/2004 to La Trobe University
A rather more impressive TID was exposed by the tomographic means that Elizabeth had developed in the following paper published after her death:
E. Yizengaw, P. L. Dyson, E. A. Essex, M. B. Moldwin, Comprehensive ionosphere dynamics study over the Southern Hemisphere during the severe magnetic storm on 31 March 2001 Annales Geophysicae, 2005, 23, 707-721, 2005 doi:10.5194/angeo-23-707-2005, 2005.

Fig 6(b) and Fig 69(c) are most striking.
The extraordinarily tall (~400km) relativey narrow (~5 degrees latitude) plasma spikes extending "finger-like" upwards as delineated in this 2005 Annales Geophysicae paper.

Note that these two figures differ by approximately 30 minutes and are (tomographic)snapshots of what is called a TID = Travelling Ionospheric Disturbance, bizarely similar -- though inverted - to an (atmospheric) hurricane.
  • A listing of the papers of Elizabeth Essex-Cohen that lead to this astonishing climax can be found here
  • The research program out of which this paper emerged can be shown delineated eight years previously here